Show Twitter Follower Count with Google Spreadsheets as a Backend
Janne Kemppainen |I was quite surprised to get my first Twitter followers after linking my earlier blog post about developing with Windows Subsystem for Linux to Twitter as I’ve never really had a social media presence outside of my own circles. This gave me the idea to track how my Twitter following develops over time when I start from zero.
Given that I’m using a static blogging environment there is no server that could actively serve this data and routing users to my home server is definitely not an option. This is where Google Spreadsheets comes in handy as it turns out that you can fetch data in CSV format without having to use strong authentication! Read more to find out how I built the follower chart below.
What are we building?
The end result of this blog post is this chart here below. It is a simple timeseries chart showing data from Google Sheets. The source code for this project is available on GitHub.
Twitter followers
This is actual data from my Twitter account and the numbers are updated daily. So if you happen to follow me it might take up to 24 hours for the chart to update. With the amount of followers I have I think it would be dumb to update more often than that :). I am not desperately trying to increase my Twitter following and I’m still quite new to it so please try not to laugh at my poor follower count. Otherwise I’ll start logging Donald Trump’s followers.
Note that you can change the chart type from the dropdown selection to see some chart types that are available with C3.js.
System architecture
Below is a chart of the whole system. The idea is that we have a Raspberry Pi running a Python script that fetches the Twitter follower count from the Twitter API. It then uses the Google Sheets API to push a new row to a published spreadsheet. When the user navigates to the website the browser will download the data from Google Spreadsheets in CSV format and display it with C3.js.
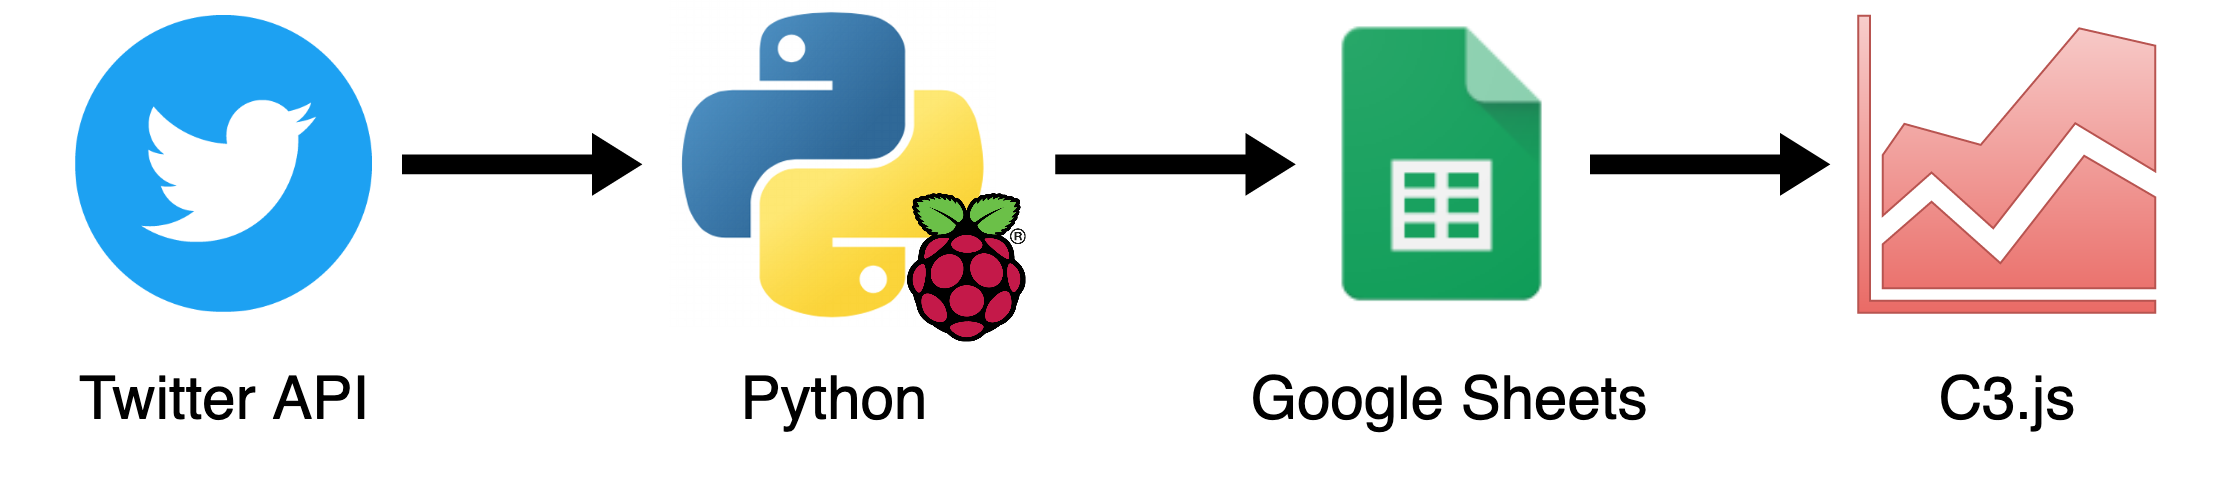
In a way the only “server” we need is the Raspberry Pi but the visitors won’t be connecting to it directly. And even if the server is shut down the existing data will still be available.
Twitter API
The first thing we will need is to create a developer account for Twitter. So go to https://developer.twitter.com/en/apply-for-access.html and apply for an account. It might take some time to get approved but at least for me it was quite fast. Put at least some effort to the application so that Twitter is less likely to think that you are a bot.
After your developer account has been approved go to the Apps page and create a new application. Fill in the required details about the application and click Create. Now you should be able to find your API keys from the Keys and tokens tab.
Google Sheets API
Next you need to configure access to the Sheets API. Create a service account key for reading/writing data with the Raspberry Pi.
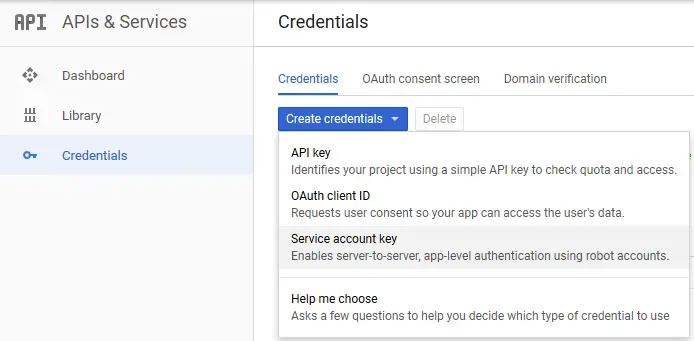
Go to https://console.developers.google.com/ and create a new project. With the project selected go to Credentials and click Create credentials. Select the Service account key option and create a new service account.
Select New service account and give it a descriptive name. On the Role dropdown box select Project > Editor. Click create.
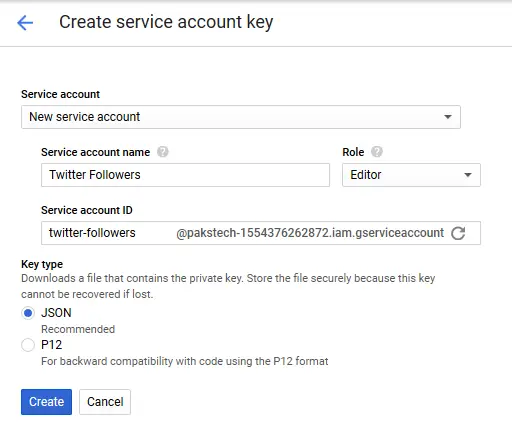
Your browser will download a JSON file that contains the required credentials for logging in to the API with OAuth2. Keep this file secured and don’t give anyone else access to it. If you lose the file you need to create a new one because it cannot be recovered from the Developer Console.
Create a new spreadsheet
Now go to Google Spreadsheets and create a new blank spreadsheet. Open the JSON file that you downloaded for the service account and copy the client_email from the file. Next, click the share button on your spreadsheet and paste the e-mail address to give the service account access to the file. Now we are able to write to the file programmatically.
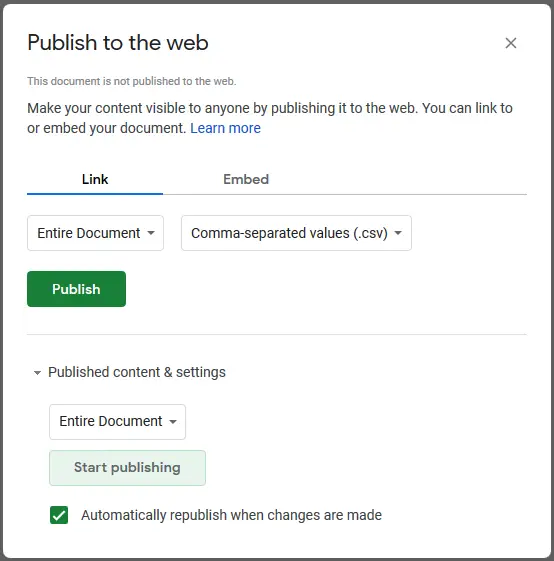
Your users won’t be able to read the file yet, though. Go to File > Publish to the web.. and select Comma-separated values (.csv) and click the Publish button.
Now you get a link where you can download the spreadsheet as a CSV file. Test that it works; we will be needing it later.
Python code
As already mentioned, the Python part of this project is responsible for fetching data from the Twitter API and uploading it to Google Spreadsheets. Luckily we don’t have to write the API calls ourselves as we can use ready libraries for communicating with those services.
Prerequisites
The prerequisites for this project are
- Python3
- Pip
- Virtualenv
If you are using Windows Subsystem for Linux or a Debian based Linux distro such as Ubuntu or Raspbian you need to install pip and venv from the package manager.
>> sudo apt install python3-pip python3-venvOtherwise you can install pip with the command
>> python3 -m ensurepipClone the project repository from GitHub
>> git clone https://github.com/pakstech/twitter-followersTwitter client
Let’s start with the Twitter communication. Inside the twitterfollowers directory you can find twitter_client.py:
import json
import tweepy


class TwitterClient:
    def __init__(self, conf_file):
        with open(conf_file, 'r') as conf_json:
            conf = json.load(conf_json)
            api_key = conf['api_key']
            api_secret_key = conf['api_secret_key']
            access_token = conf['access_token']
            access_token_secret = conf['access_token_secret']

            auth = tweepy.OAuthHandler(api_key, api_secret_key)
            auth.set_access_token(access_token, access_token_secret)

            self.api = tweepy.API(auth)

    def get_follower_count(self, username):
        return self.api.get_user(username).followers_count
This is a really simple class that initializes the API client with the secrets and exposes a single method to get the follower count for a specific user. Internally it uses the Tweepy library that does all the heavy lifting for us.
The __init__ method creates the Tweepy API object that can be used to make authenticated requests to the Twitter API. The get_follower_count method uses this object to fetch data for a user and extracts the number of followers to be returned.
The Tweepy library is really versatile and allows you to create new tweets, read/send direct messages, add friends etc. You can read more about it from the API refernce.
Google Spreadsheets client
The second part of the equation is Google Spreadsheets and naturally we need another class for handling communication with the Google API. This code is not that much longer:
| |
For this class we need two external libraries: gspread and oauth2client. They handle the authentication and talking with the Google servers.
The __init__ method starts with the scope definition for the authentication request. It is used to define what the application is allowed to do with the authentication credentials. You can find a list of all valid scopes from the Google Identity Platform. The scope that we are using can be found under the Google Sheets API, v4 and it allows us to “see, edit, create and delete your spreadsheets in Google Drive”.
The config_file parameter is the path to the service account authentication credentials JSON file. The oauth2client library uses this file to read the authentication keys and the resulting credentials object is passed on to the gspread library which creates the client object that is used to open the spreadsheet. The first sheet of the spreadsheet is stored to self.sheet for later use.
The _init_sheet private method starts by creating the table headers if they don’t exist. Then it checks whether the sheet already contains any data or not. By default a new sheet has 1000 rows of blank cells. The first row of the file is used for the row headings so the actual data starts from the second row. The code tries to fetch the value of the first data cell A2 and if the result is empty it will shrink the whole sheet to one line.
Finally there is the append_data method which takes the data to be written as an array. Because we shrank the size of the spreadsheet to one we can use the more performant append_row method that appends a new line at the end of the file instead of trying to search for the last row before writing.
The main script
The glue between the previous classes is here below. This is the main script that reads the arguments from the command line, uses the TwitterClient to fetch the follower count, and updates the spreadsheet using the SpreadsheetClient. The code should be quite self-explanatory, spend a minute to understand how it works.
| |
I also included a small Bash script for handling the Python virtualenv and installing the required packages.
#!/bin/bash

DIR=$(dirname "$0")

cd "${DIR}" || exit 1
if [[ ! -d "bin" ]]; then
    python3 -m venv .
    . bin/activate
    python3 -m pip install -r requirements.txt
fi

. bin/activate

python3 followers.py "$@"
This will check for the existence of the virtual environment, create it if necessary, and install the Pip requirements. It will then activate the virtual environment and call the Python script with the command line arguments it was given.
Test if it works
The git repository contains a file called twitter.json.example. Copy it to a file named twitter.json and change the key values to those from your Twitter API page. Also copy the JSON credentials file for your Google service account to a file called google.json.
Copy the ID of your spreadsheet from the the URL (for example: 1alD43YGgbqfO0KtZSY7Zur8mLgZHctH8FQhKCsP6vt0). Then run the script using the twitter account name of your choice:
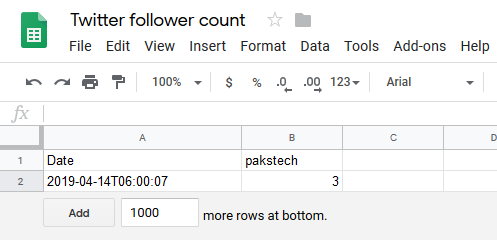
>> bash followers.sh --account pakstech --spreadsheet_id 1alD43YGgbqfO0KtZSY7Zur8mLgZHctH8FQhKCsP6vt0If you now look at the spreadsheet with the browser you should see that it has some new data:
Setup for Raspberry Pi
Now that the script works it is time to configure it to run periodically on the Raspberry Pi.
If you haven’t already done so install Python 3 pip and virtualenv to the Pi with
>> sudo apt install python3-pip python3-venvClone the repository to the Pi and add the JSON files for authentication just as you did before. Test that the script works:
>> bash followers.sh --account pakstech --spreadsheet_id 1alD43YGgbqfO0KtZSY7Zur8mLgZHctH8FQhKCsP6vt0Replace the arguments with your twitter handle and spreadsheet ID. After verifying that the script works add it to crontab:
>> crontab -eAssuming that you cloned the repository to the home directory of the pi user add a new line at the end of the cron configuration:
>> 0 6 * * * bash /home/pi/twitter-followers/followers.sh --account pakstech --spreadsheet_id 1alD43YGgbqfO0KtZSY7Zur8mLgZHctH8FQhKCsP6vt0 >/dev/null 2>&1This will run the script daily at six in the morning.
Displaying the data
So now that we have the Raspberry Pi automatically logging the follower count the last thing we need to do is to display it somehow. We are going to use two JavaScript libraries called D3.js and C3.js. C3 is a chart library built on top of D3.
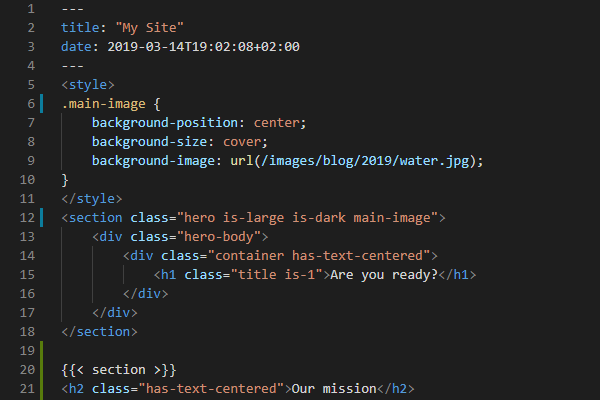
Below is a sample HTML page that reads the data from Google Sheets and displays it as a timeseries using C3.
<!DOCTYPE html>
<html lang="en">

<head>
    <meta charset="UTF-8">
    <meta name="viewport" content="width=device-width, initial-scale=1.0">
    <meta http-equiv="X-UA-Compatible" content="ie=edge">
    <title>Twitter Followers</title>
    <link rel="stylesheet" href="https://cdnjs.cloudflare.com/ajax/libs/c3/0.7.0/c3.min.css" />
    <script src="https://cdnjs.cloudflare.com/ajax/libs/d3/5.9.2/d3.min.js"></script>
    <script src="https://cdnjs.cloudflare.com/ajax/libs/c3/0.7.0/c3.min.js"></script>
    <script type="text/javascript">
        var chart = c3.generate({
            bindto: "#chart",
            data: {
                url: 'https://docs.google.com/spreadsheets/d/e/2PACX-1vSTX9HuuS01jgFs1y0sdGKmDFqVeP81UZ5J2ojY9MJUjM1HriwnZrICTxVKBABR2hBdHGvdkQzYLwPC/pub?output=csv',
                type: 'spline',
                x: "Date",
                xFormat: '%Y-%m-%dT%H:%M:%S',
            },
            axis: {
                x: {
                    type: 'timeseries',
                    tick: {
                        count: 5,
                        format: '%Y-%m-%d'
                    }
                },
            },
            title: {
                text: "Twitter followers"
            }
        });
    </script>
</head>

<body>
    <div id="chart"></div>
</body>

</html>
To use C3 you need to link the C3 CSS file as well as include the JavaScript files for D3 and C3. The custom script generates a chart that is bound to the div with the id chart.
The data input is a link to the shared spreadsheet CSV url from the “Publish to the web” selection. C3 handles CSV files nicely so we don’t have to do custom parsing for the data. The first row of the data is automatically considered as the column headings.
The type parameter sets the chart type, the available values as of version 0.7 are
- line
- spline
- step
- area
- area-spline
- area-step
- bar
- scatter
- stanford
- pie
- donut
- gauge
With the x parameter we can select the Date column as the x-axis. The xFormat defines how the time data is interpreted so we need to use the same format as in the Python script.
The x-axis needs to be defined separately as a timeseries so that it is displayed properly on the chart. By default C3 adds a tick for each data entry but it easily gets crowded if there are many data points so we can reduce the tick count. Also the format can be simplified by changing the format. This doesn’t affect the actual positions of the data items but only shortens the time ticks by dropping out the hours, minutes and seconds.
Finally, we can set a title text for the chart. Modify the HTML file for your data and see how it renders on a browser.
Trying to open the file straight from the file system won’t work; you will need to host the file on a local server for this to work due to CORS headers. One option is to place the file in the static directory of a Hugo site and use the Hugo development server for hosting the file locally.
For further enhancements you can take a look at the C3 reference.
Conclusion
Updating data to Google Sheets turns out to be surprisingly simple with the help of libraries. And the publishing model suits the needs of a static site perfectly as the data can be fetched dynamically from Google’s servers without the need to rebuild the site every time the data changes.
In theory Google Sheets could even be used as sort of a content management system but that would be a subject for another blog post..
Previous post
Set Up a Raspberry Pi Home Server With Remote Access