Analytics Addiction is a Thing
Janne Kemppainen |So you started a blog, wrote a few articles, configured Google Analytics, and now find yourself constantly checking if anyone is visiting your site? I know how you feel, I’ve felt the urge to check my stats basically every day since my blog went online. In this post I’m going to share how I changed my mindset to overcome this huge time sink.
Starting a blog is exciting, except when it is not
You start your blog with big expectations. “If you just write, people will come”.
You try to create content that others are searching for, something that is not too competitive so that you have a chance of ranking on Google against the big players.
The thing with search engine traffic is that it can take months until you start seeing a reasonable amount of visitors. In the beginning Google doesn’t know or trust your site so you will only get a trickle of visitors. Maybe on a good day you’ll get five visitors, two of which turn out to be bots.
Depending on how much content you put out and how actively you promote it on social media this ghost town phase can last a few months. You come back time and time again to see that the monthly page views are still under one hundred.
Then, after some time, your audience starts to grow. First you get to a hundred unique visitors in one month, then two, three, four.. After a while you start counting the visits in thousands. You celebrate all these milestones, but always want and need more.
Month by month, week by week you see the audience grow and start to get excited. If the growth stops you start to wonder what you are doing wrong. Why did I get less visitors this month than the month before? Did Google not like my content after all? Is the traffic going to go back to zero? Was I hit by an algorithm update? Is this a seasonal trend?
You start to worry why some articles are losing rankings. You check Google Analytics and Google Search Console multiple times a day. How does this day compare to the same day last week? Am I on track to get more or less visitors? What pages seem to be emerging and gaining popularity?
It is almost an involuntary action to open the browser and check how the site is doing.
STOP!
Break from the loop
You’ve become addicted of analytics. You check the stats when you should be writing new content instead. You enjoy your victories but fear that it won’t last. You contribute less, because you’re so preoccupied with the meta-work that only makes you more worried. Then you feel guilty of not spending your time wisely.
The first step is to accept that you’ve become to rely on the habit of checking the stats. You know that it isn’t really productive, and you may even understand that it can be detrimental to your ultimate success.
Next, be determined that you want to break from this loop. It can take a lot of willpower, and the urge to open your browser and navigate to your analytics site can feel overwhelming during the first days. You might even feel withdrawal symptoms, a weird feeling in your stomach when you think about your site.
Choose one day of the week when you are allowed to check the stats, all the other days are then banned. No matter how much you’re tempted, stay strong and tell yourself “once a week is enough”. Remove any apps from your phone.
Healthy analysis
It is helpful to gain insights on what kind of content works well and resonates with your audience. The point is to do analysis only after you have gained enough relevant new information. That is why I think once a week is a good timeframe, since you have seven days worth of new data to analyze. Daily analysis is too fast for the typical nature of a site’s traffic and will only stress you out.
A week is also short enough so that it doesn’t feel too extreme and difficult to think of. On more passive sites that don’t get updated so often you might even go as far as to ignore them for months.
I chose to set my analysis day on Sundays. Weekends are typically the quietest days so there usually isn’t anything special happening and I can concentrate on the previous seven days.
One mind trick is to write down the visitor count for the last 7 and 30 days to a spreadsheet or a note. You write these two values down every week, and you can then look at them during the week if you want. This naturally slows down your measurement cycle.
During those selected days you can do as detailed analysis as needed. If you notice something important, write that down and create action points that should be fixed during the week. You can then come back to them the next time and track the progress, if applicable.
Surprise events
Last Sunday I had already been doing this once a week checkup for three weeks. I logged into Google Analytics normally, and saw an awful lot of traffic that must’ve been bots that were not being filtered out for some reason.
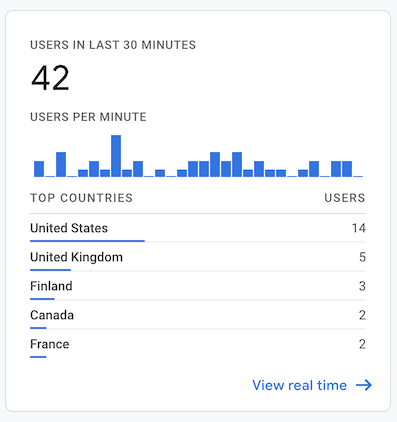
Then I checked the traffic source and referrers again, and realized that the traffic was real, coming from Hacker News. Someone had posted one of my articles there and it was driving quite a lot of traffic, around 5,000 visitors that day.
That is about half of what I currently get in 30 days, so naturally it was a big thing for me! At one point there were 50 users in the last 30 minutes, when I took this screenshot there were 42.
You can imagine how difficult it was for me to close the browser tabs without looking the next day!
But that’s the thing! You can come up with excuses to do it just this once. After a while you find yourself in the same old loop, finding more and more reasons to break the rules.
I managed to click away. This Sunday I’ll have some interesting analysis ahead.
Discuss on Twitter
If you're a content creator of any sort, you probably know how addictive it can be to constantly monitor your analytics. Here's how I'm attempting to handle the situation. https://t.co/YxemDgROKn
— Janne Kemppainen (@pakstech) April 10, 2021
Previous post
Comparing Markdown-based Note Taking SoftwareNext post
AWS Security Groups Explained